6 min read

UML Diagrams are a standard way to visualize a system or process. Learn about the types of UML diagrams and how they can help your teams collaborate.
Some people say that a picture is worth a thousand words. Bluescape has everything you need to visualize a process, especially during the development phase, and helps teams communicate and collaborate more effectively.
The software development industry in the past has used dozens of ways to model and visualize development, but since 1997, UML or Unified Modeling Language has been the industry standard for software modeling. Read on to learn more about what UML is, the types of UML diagrams, and how to use a UML diagram to benefit your collaboration.
What is a UML Diagram?
UML stands for Unified Modeling Language, and it is a modeling language that is most often used for software engineering but has extended its use to business processes and other project workflows. Essentially, UML is visualizing software through diagrams, specifically one of the thirteen UML diagrams. This modeling language was created by three software engineers at the company Rational Software for their projects, and it has become the standard with very few updates over the years.
What is a UML Diagram used for?
A UML diagram is typically used in software engineering and other business processes where modeling is useful. There are two main ways UML diagrams are used as a part of these processes:
- Forward design. The modeling and design are all done before coding the software application. Usually, forward design is used to help developers better see the system they are trying to create.
- Backward design. The modeling is done after the code has been written, and the UML diagrams act as documentation for the workflow of the project. This can help developers see the project development as it was, in reality, to improve in the future.
 Whether UML diagrams are used before or after the coding or project, they provide a way to visualize many aspects of a project and who is responsible for what activity.
Types of UML Diagrams
The original UML had nine types of diagrams, and the second version raised that to thirteen types of diagrams. Each diagram can be divided into two categories: structural diagrams and behavioral diagrams. A structural diagram will break down the project by the process or way the project is set up.
A behavioral diagram will break down the project by how the system behaves and how its components and actors are involved. Here are each of the types of UML diagrams explained.
Structural Diagrams
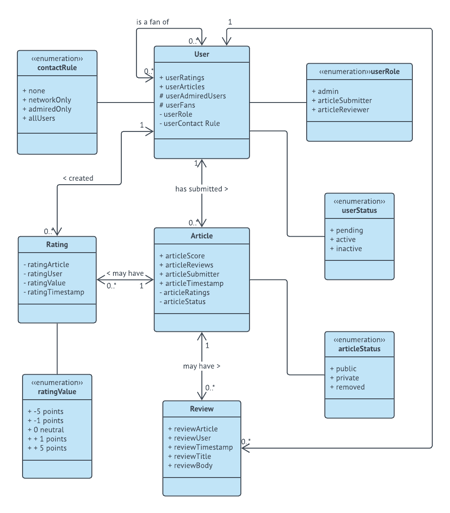
- Class diagram. This is the most common type of documentation diagram for software. The diagram has three fields where the first one is the class, then its attributes right beneath it, and finally the behaviors are in the third field. Then different types of lines connect each class to show the relationships between the classes.
- Object diagram. This diagram is, in a way, a subset of the class diagrams. Object diagrams display a particular instance of a class. For example, if a class diagram had the class of “Customers,” the object diagram might have “Customer 1” to show the attributes and behaviors of that particular customer. These diagrams allow developers to see if the system they created with a class diagram is viable when put into practice.
- Composite structure diagram. As another further subset of class diagrams, composite structure diagrams show the internal structure of a class. Each class is broken down into its components, and the connecting lines are drawn between the components to show how each relates and communicates. It’s an extremely specific diagram, so it’s used less often, especially in a business environment.
- Package diagram. This type of diagram helps show the big picture by organizing elements of the system into groups called packages. The packages are then sorted into related groups, and those groups are connected to show relationships or interaction. Package diagrams help show complex systems and complex behaviors that might be hard to visualize in detail.
- Component diagram. It can be difficult to visualize complex systems, but that is what a component diagram is designed to do. The system is broken down into its components, which communicate with each other through interfaces. The interfaces are connected to show the path of component communication. These diagrams provide a bird’s eye overview of a complex system or process.
- Deployment diagram. This diagram shows the relationship between software and the physical hardware it’s deployed through. Deployment diagrams are a physical model of how each software component (called artifacts) is deployed through its hardware node and the connections between all of the software and hardware elements. This diagram is typically only useful for software development because of its focus on hardware.
Behavioral Diagrams
- Activity diagram. Activity diagrams are some of the most useful diagrams, especially for business processes. These diagrams show the workflow of a project or operational process, and they can show the relationship between different activities. The flow between activities can be both parallel and sequential. The diagram will usually display the materials used, objects produced by activities, and the relationship between each.
- Interaction overview diagram. While activity diagrams show the sequence of processes, interaction overview diagrams show the sequence of object interactions in the correct order. Arrows are used to show the flow between the interactions. These are some of the most complex UML diagrams, and it uses the same annotations as an activity diagram.
- Sequence diagram. As the same suggests, this diagram shows the sequence of interactions in a system chronologically during a particular process. All communication between actors or objects is shown with a variety of connecting lines, and actors don’t need to be active until another actor communicates with them. Visually these diagrams are structured vertically with chronological, top-down organization. These diagrams are important for the development of any kind of application, not just software.
- Communication diagram. These diagrams are similar to sequence diagrams, but the main focus here is on the communication between objects, not all types of interaction. Communication diagrams follow a numbering system to show chronology and arrows to show the flow of messages. On the diagram, the objects don’t have to be physically close to each other to communicate; they only need to be included in the numbering and have an arrow connecting them to another object.
- Timing diagram. If the focus of a project is the timing of events, this diagram is the best to use. Like a sequence diagram, this shows the sequence of events, but instead of connecting by a relationship, each event is shown to flow along a linear axis of time, usually from left to right. The main focus is the duration of time, and the diagram often shows this with a staircase and arrows displaying the time constraint.
- Use-case diagram. These diagrams give an overview of all of the actors, the functions each actor needs to perform, and how the functions interact within a system. The goal is to visualize the functions of each actor involved and how all of the actors and functions are related to each other. Usually, actors are connected to their functions with arrows, and related functions are connected to each other with different arrows.
- State diagram. Also known as statechart diagrams, these show the state of a system when it’s acted on by an external or internal stimulus. The diagram visualizes the many states of a system and how it could change if certain external or internal events take place and all of the actions in between.
Static and Dynamic UML Diagrams
Modeling usually involves a static or dynamic model, and sometimes both are used. Some of the types of UML models are static and some are dynamic, so a developer can use UML for both types of modeling.
- Static modeling shows things like classes, objects, interfaces, and the relationships between these. The class diagrams and object diagrams are both UML types of static modeling.
- Dynamic modeling shows the behavior of the static aspects of a system. This type of modeling can also be used to show a workflow, passage of time, and different states. In this type of modeling, something will be changing, whereas in static nothing is changing. In UML, the interaction diagrams, object diagrams, and activity diagrams are ways to use dynamic modeling.
Importance of UML Diagram
UML diagrams can be used as a way to visualize a project before it takes place or as documentation for a project afterward. But the overall goal of UML diagrams is to allow teams to visualize how a project is or will be working, and they can be used in any field, not just software engineering. The diagrams will allow teams to visualize together how a system or process will work or did work. It can provide new ideas for how the team needs to collaborate to achieve the goal of the workflow process.
A UML diagram won’t help a team visualize a project and collaborate if a team member is unable to see the diagram and any updates or changes in real-time. Bluescape is a virtual whiteboard that can be displayed on any device. Once a UML diagram is added to the whiteboard, every team member can see it—and any changes—anywhere at any time. With our virtual whiteboard, teams will be able to fully utilize UML diagrams for collaboration.